1. Summary 
This report documents a stock portfolio management system built using SQL queries with fictional data. The project demonstrates my ability to manage investment data, calculate key financial metrics, and generate actionable insights for portfolio analysis and risk management.
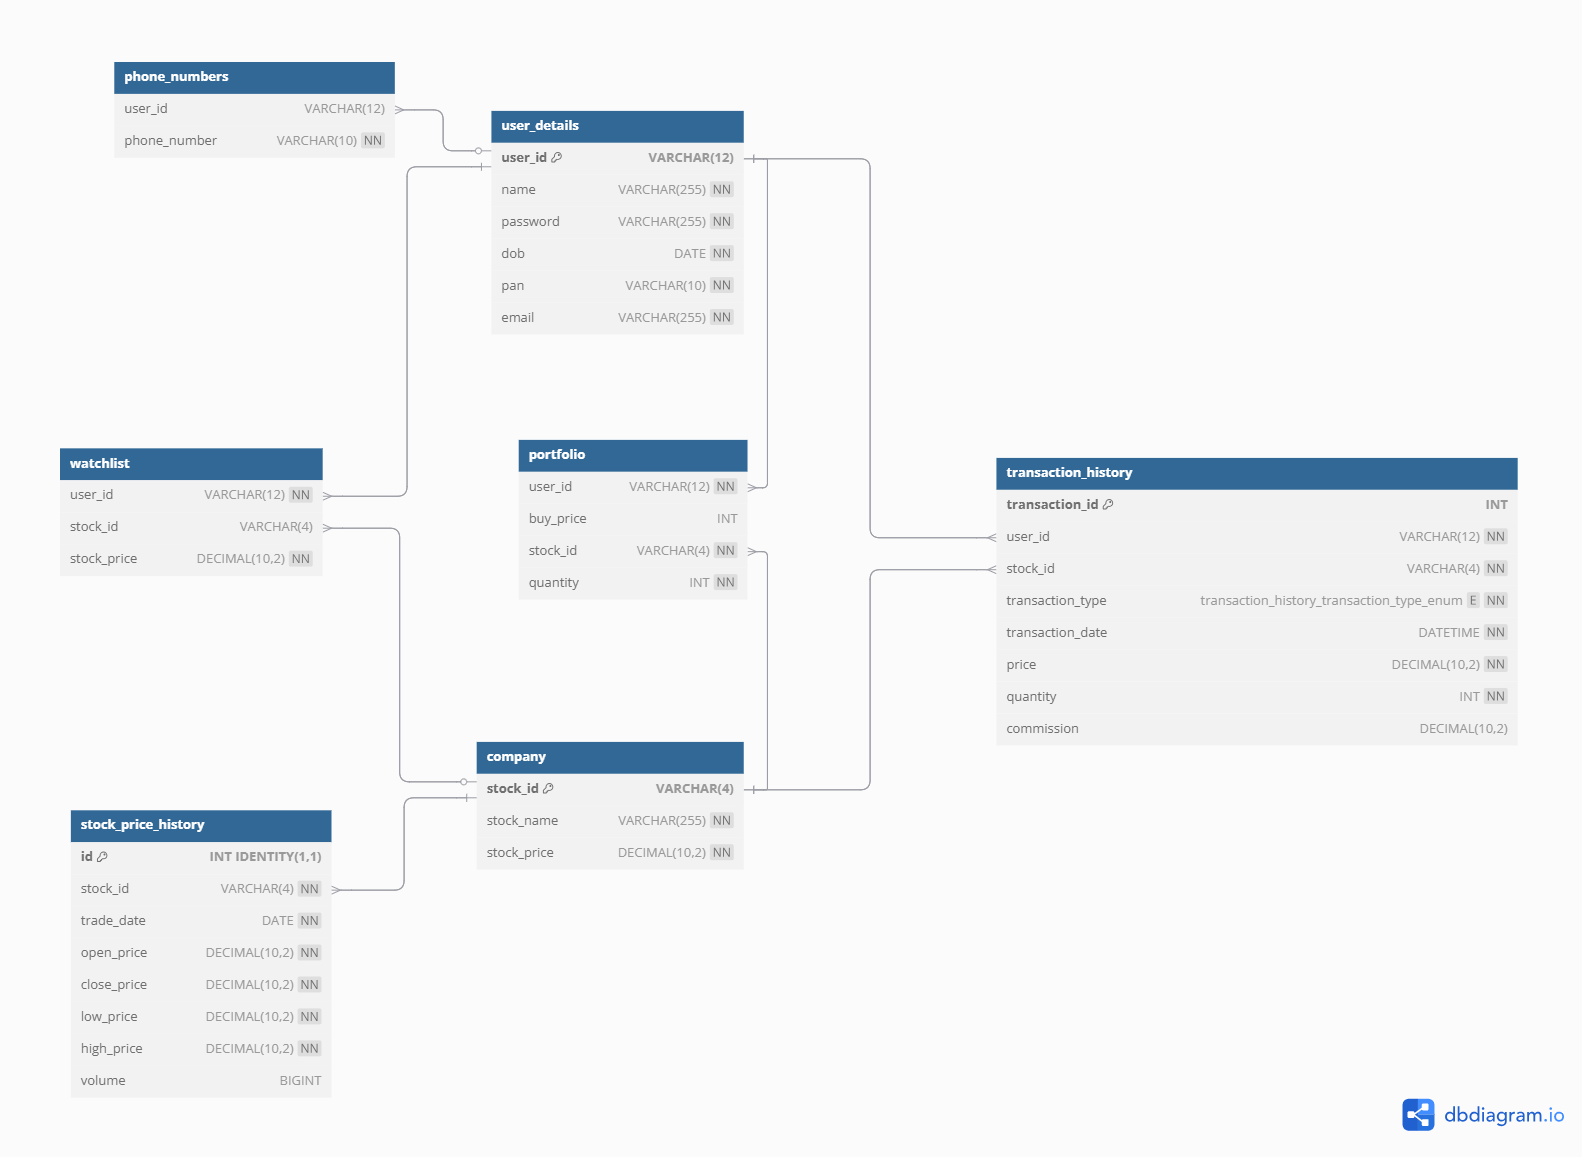
2. Database Schema Overview 
3. Project Objectives: 
- Track portfolio value and daily changes
- Analyze daily returns and volatility
- Identify diversification issues
- Quantify the impact of trading commissions
- Generate trading signals based on moving averages
- Separate realized and unrealized gains
4. Project 
I first created two views of data used in different queries in the analysis:
- One for valuation over time for each portfolio/user
- One for daily returns
CREATE OR ALTER VIEW valuation_over_time AS
SELECT p.user_id,
        sph.trade_date,
        SUM(p.quantity * sph.close_price) as portfolio_value,
        ROUND(SUM(p.quantity * sph.close_price) - LAG(SUM(p.quantity * sph.close_price)) OVER (PARTITION BY p.user_id ORDER BY sph.trade_date), 2) as daily_change
    FROM portfolio as p
    JOIN stock_price_history as sph ON p.stock_id = sph.stock_id
    GROUP BY p.user_id, sph.trade_date
GO

CREATE OR ALTER VIEW daily_returns AS
    SELECT
        trade_date,
        user_id,
        ROUND((portfolio_value - LAG(portfolio_value) OVER (PARTITION BY user_id ORDER BY trade_date))
        / NULLIF(LAG(portfolio_value) OVER (PARTITION BY user_id ORDER BY trade_date), 0), 2) as daily_return
    FROM valuation_over_time
GO
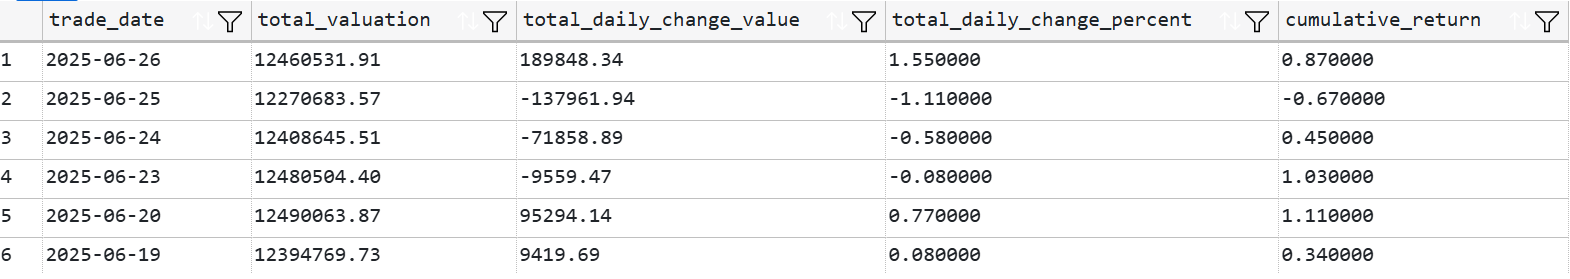
Valuation Over Time For All Portfolios Combined 
I started with a CTE for total daily valuation for all portfolios combined. I then added columns for total daily changes in values and in percentages, and cumulative returns.
WITH daily_totals AS (
SELECT
    trade_date,
    SUM(portfolio_value) as total_valuation
FROM valuation_over_time
GROUP BY trade_date
)

SELECT
    trade_date,
    total_valuation,
    ROUND(total_valuation - LAG(total_valuation) OVER (ORDER BY trade_date), 2) as total_daily_change_value,
    ROUND((total_valuation - LAG(total_valuation) OVER (ORDER BY trade_date))
        / NULLIF(LAG(total_valuation) OVER (ORDER BY trade_date), 0) * 100, 2) as total_daily_change_percent,
    ROUND((total_valuation - FIRST_VALUE(total_valuation) OVER (ORDER BY trade_date))
        / NULLIF(FIRST_VALUE(total_valuation) OVER (ORDER BY trade_date), 0) * 100, 2) as cumulative_return
FROM daily_totals
ORDER BY trade_date DESC
;
Sample results:
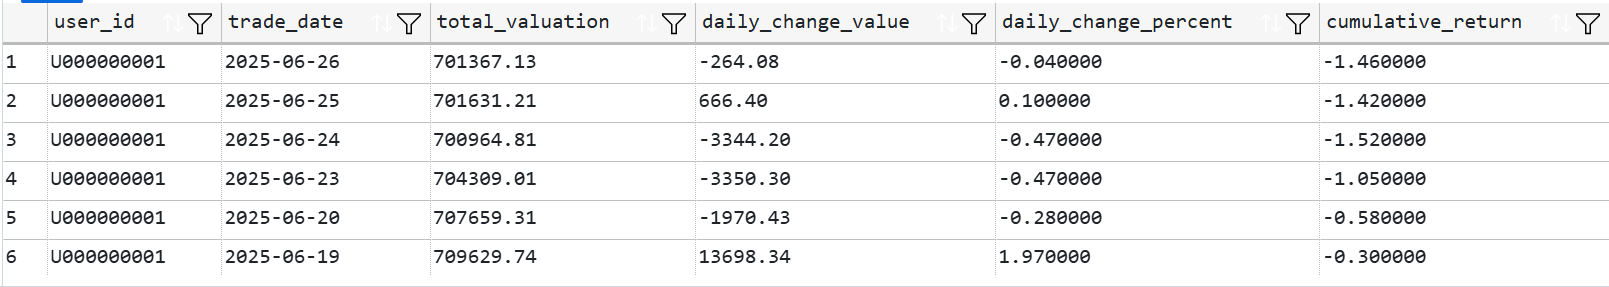
Portfolio Valuation Per User 
For this analysis I copied pasted the previous query adding "PARTITION BY user_id" for each calculation to get valuations for each user's portfolio.
WITH daily_totals AS (
SELECT
    user_id,
    trade_date,
    SUM(portfolio_value) as total_valuation
FROM valuation_over_time
GROUP BY user_id, trade_date
)

SELECT
    user_id,
    trade_date,
    total_valuation,
    ROUND(total_valuation - LAG(total_valuation) OVER (PARTITION BY user_id ORDER BY trade_date), 2) as daily_change_value,
    ROUND((total_valuation - LAG(total_valuation) OVER (PARTITION BY user_id ORDER BY trade_date))
        / NULLIF(LAG(total_valuation) OVER (PARTITION BY user_id ORDER BY trade_date), 0) * 100, 2) as daily_change_percent,
    ROUND((total_valuation - FIRST_VALUE(total_valuation) OVER (PARTITION BY user_id ORDER BY trade_date))
        / NULLIF(FIRST_VALUE(total_valuation) OVER (PARTITION BY user_id ORDER BY trade_date), 0) * 100, 2) as cumulative_return
FROM daily_totals
ORDER BY user_id, trade_date DESC
;
Sample results:
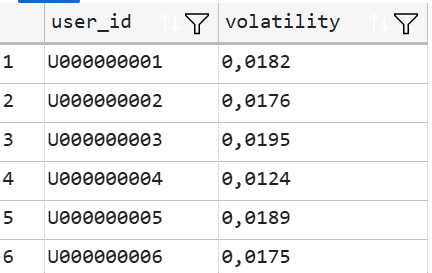
SELECT
    user_id,
    ROUND(STDEV(daily_return), 4) as volatility
FROM daily_returns
WHERE daily_return IS NOT NULL
GROUP BY user_id
GO
Sample results:
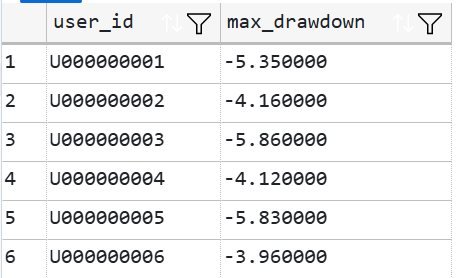
2. Drawdowns 
To compute drawdowns I created two CTEs, one to find the running maximum for each portfolio and trade date, and one to calculate the drawdowns. I then had to find minimum drawdown percents to find the maximum drawdowns for each portfolio.
WITH running_max AS (
    SELECT
        user_id,
        trade_date,
        portfolio_value,
        MAX(portfolio_value) OVER (PARTITION BY user_id ORDER BY trade_date) as max_to_date
    FROM valuation_over_time
)
,

drawdowns AS (
    SELECT
        user_id,
        trade_date,
        portfolio_value,
        max_to_date,
        ROUND((portfolio_value - max_to_date) / NULLIF(max_to_date, 0) * 100, 2) as drawdown_percent
    FROM running_max
)

SELECT
    user_id,
    MIN(drawdown_percent) as max_drawdown
FROM drawdowns
GROUP BY user_id
GO
Sample results:
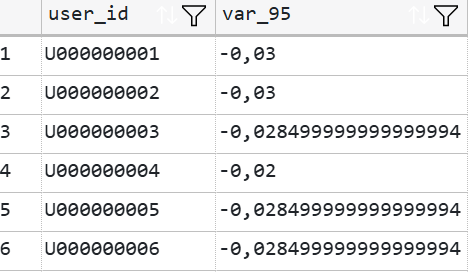
3. Value at Risk 95 
The query uses a subquery to get each user’s VaR at 95% confidence with PERCENTILE_CONT(0.05) on daily returns. I added a row number to select only one row per user with "WHERE rn = 1" and avoid duplicates in the output.
SELECT
    user_id,
    var_95
FROM (
    SELECT
        user_id,
        PERCENTILE_CONT(0.05) WITHIN GROUP (ORDER BY daily_return) OVER (PARTITION BY user_id) AS var_95,
        ROW_NUMBER() OVER (PARTITION BY user_id ORDER BY trade_date) AS rn
    FROM daily_returns
    WHERE daily_return IS NOT NULL
) ranked
WHERE rn = 1
;
Sample results:
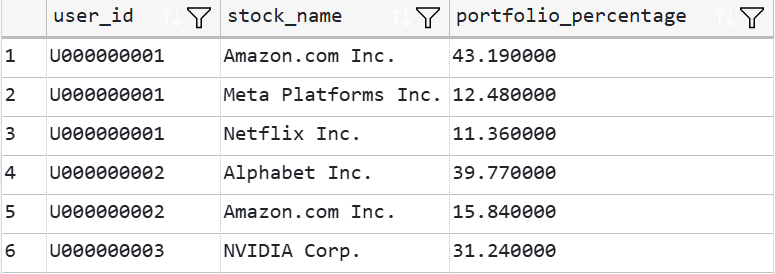
Concentration Risks 
The following query identifies stocks exceeding 10% of portfolio value to highlight diversification issues. To do so I joined two tables together, portfolio and company (to get each stock_id's name), and had to perform a join on a new table created out of joining the same two original tables to divide by the total values of each portfolio. Note: I could have used a view created earlier or a CTE, but the goal here was to demonstrate different querying techniques.
SELECT
    p.user_id,
    c.stock_name,
    ROUND((SUM(p.quantity * c.stock_price) / user_totals.total_value) * 100, 2) AS portfolio_percentage
FROM portfolio p
JOIN company c ON p.stock_id = c.stock_id
JOIN (
    SELECT
        user_id,
        SUM(p2.quantity * c2.stock_price) AS total_value
    FROM portfolio p2
    JOIN company c2 ON p2.stock_id = c2.stock_id
    GROUP BY user_id
) AS user_totals ON p.user_id = user_totals.user_id
GROUP BY p.user_id, c.stock_name, user_totals.total_value
HAVING ROUND((SUM(p.quantity * c.stock_price) / user_totals.total_value) * 100, 2) > 10
;
Sample results:
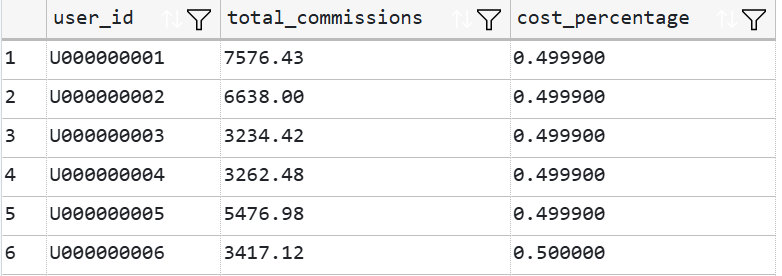
Transaction Cost Impact 
I then quantified how trading commissions impact overall returns with simple techniques.
SELECT
    user_id,
    SUM(commission) as total_commissions,
    ROUND(SUM(commission) / SUM(ABS(quantity * price)) *100, 6) as cost_percentage
FROM transaction_history
GROUP BY user_id
ORDER BY user_id
;
Sample results:
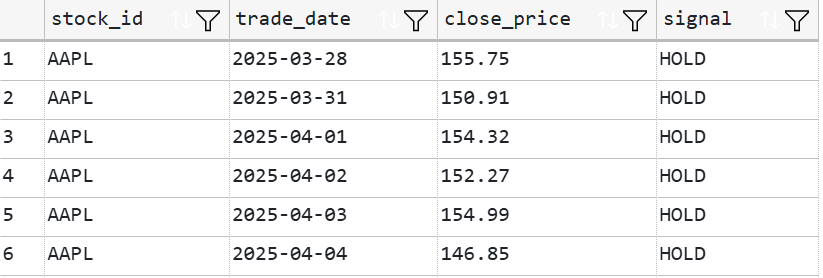
Moving Averages and Trading Signals 
I used moving averages on 10 and 30 days to generate trading signals at crossovers. To do so I first created a CTE to calculate the moving averages, and then used it in a CASE statement to generate 'BUY', 'SELL' and 'HOLD' orders.
WITH moving_averages as (
    SELECT
        stock_id,
        trade_date,
        close_price,
        AVG(close_price) OVER (PARTITION BY stock_id ORDER BY trade_date ROWS BETWEEN 9 PRECEDING AND CURRENT ROW) as mav_10,
        AVG(close_price) OVER (PARTITION BY stock_id ORDER BY trade_date ROWS BETWEEN 29 PRECEDING AND CURRENT ROW) as mav_30
    FROM stock_price_history
)

SELECT
    stock_id,
    trade_date,
    close_price,
    CASE
        WHEN mav_10 > mav_30
            AND LAG(mav_10) OVER (PARTITION BY stock_id ORDER BY trade_date) <= LAG(mav_30) OVER (PARTITION BY stock_id ORDER BY trade_date)
            THEN 'BUY'
        WHEN mav_10 < mav_30
            AND LAG(mav_10) OVER (PARTITION BY stock_id ORDER BY trade_date) >= LAG(mav_30) OVER (PARTITION BY stock_id ORDER BY trade_date)
            THEN 'SELL'
        ELSE 'HOLD'
    END AS signal
FROM moving_averages
;
Sample results:
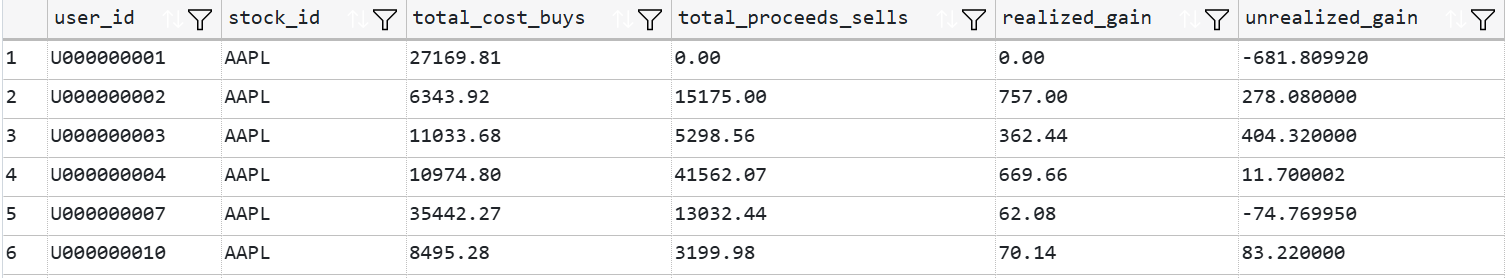
Realized and Unrealized Gains 
In a CTE, I used the transaction types and a CASE statement to calculate separetly the quantity bought and sold, as well as the total costs from buying and proceeds from sells, which are then used in the final analysis.
WITH transactions_agg AS (
    SELECT
        user_id,
        stock_id,
        SUM(CASE WHEN transaction_type = 'BUY' THEN quantity ELSE 0 END) AS total_bought,
        SUM(CASE WHEN transaction_type = 'SELL' THEN quantity ELSE 0 END) AS total_sold,
        SUM(CASE WHEN transaction_type = 'BUY' THEN quantity * price ELSE 0 END) AS total_cost_buys,
        SUM(CASE WHEN transaction_type = 'SELL' THEN quantity * price ELSE 0 END) AS total_proceeds_sells
    FROM transaction_history
    GROUP BY user_id, stock_id
)

SELECT
    p.user_id,
    p.stock_id,
    ta.total_cost_buys,
    ta.total_proceeds_sells,
    (ta.total_proceeds_sells - (ta.total_cost_buys / NULLIF(ta.total_bought, 0) * ta.total_sold)) AS realized_gain,
    (p.quantity * c.stock_price - ((ta.total_cost_buys / NULLIF(ta.total_bought, 0)) * p.quantity)) AS unrealized_gain
FROM portfolio p
JOIN company c ON p.stock_id = c.stock_id
LEFT JOIN transactions_agg ta ON p.user_id = ta.user_id AND p.stock_id = ta.stock_id
;
Sample results: